A Glass Ceiling Above the Wall of Silence
The term “Glass Ceiling” was first used 43 years ago, in 1978, to describe what seemed to be an invisible barrier that kept women from getting equal pay and the top executive jobs in companies all around North America. Over time, the concept grew to include other demographic groups like visible minorities or those with physical disabilities. Study after study showed that the trend was real. Nearly a half-decade later, and it looks like the “Glass Ceiling” is still intact within the Municipality of Chatham-Kent.
The Municipality of Chatham-Kent is the largest single employer in our local region. Hiring for diversity in both leadership and lower positions has become commonplace, at least in talk. Every published employment opportunity states, “The Municipality of Chatham-Kent is an equal opportunity employer, committed to fair and accessible employment practices that attract and retain talented employees in a workplace that is inclusive, supportive, and reflective of the diverse community we serve.”
So, does our largest local employer have a workforce that looks like Chatham-Kent?
Working through a Ward 6 Councilor it was suggested to contact Jim Blake, who is the Communications Officer for the Municipality. He responded that any questions about hiring, diversity and numbers would best be handled by the Human Resources department and contacting Cathy Hoffman, who is the General Manager and thus the head of the department, would be the best way to go.
This quickly brought into focus one of the biggest challenges in trying to get information from the Municipality. There often seems to be a wall of silence when trying to get information. It almost seems like there is a deep-seated aversion to someone from the general public questioning them. Ultimately, as Councilor Bondy stated in a previous interview: in the case of a general inquiry, Municipal staff are left to their own discretion whether to respond or not.
Far too often, their decision is to not respond which is the choice that Ms. Hoffman made as well. An opportunity for transparency around Municipal Hiring practices was lost along with the insight that could have been very enlightening in interpreting the data.
The Data
There were two readily available sources of data draw from. The first was the Municipal Org Chart from April 2021. The second was the 2021 Sunshine List–those that earned over $100,000 last year. These two sources really only allowed for a comparison between men and women within the Municipality of Chatham-Kent. There was no data source that would account for disabilities or ethnic identification, so those factors remained outside of the scope of this article.
Org Chart for the Municipality of Chatham-Kent
The Municipal Org chart from April 2021 divides the Municipality into 4 colour-coded tiers representing 6 different levels of management. At the top is the CAO’s office. Technically, this is its own tier, but for this analysis, it has been grouped into the General Manager tier as its colour coding indicates
The next level down is the Director-level positions indicated by the pink colour. There are a few positions counted in this level that do not have the title of Director, particularly in the Fire Department, but since they show up in the pink boxes too, this is where they will be counted.
Finally, the white boxes contain two tiers-managers and coordinators/supervisors. Both types of positions appear on the chart in white, but managers are clearly higher up in the hierarchy. It is clear from reporting lines that there are is a definite reporting structure contained within this level.
What does the data say?
Starting at the top tier, the upper-est of the upper management, there are 8 positions, including the CAO. Of those eight, two of them are filled by women. That’s an 80% to 20% split in favour of the men.
The next tier down is the Director level. Here there are 27 positions, 18 of which are filled by men and 9 by women, for a 67% to 33% split. Included in this count are six “Director Level” positions within the Fire Department, a traditionally male-dominated occupation. Nothing bucks that trend in CK, as all of these positions are filled by men. If we remove the Fire department from the equations, we find that men still lead, 12 to 9, for a 57% to 43% split.
Within the management level, there is a large increase in employee numbers. Out of the 55 positions that could be considered a “manager”, 29 are male with 26 female. This represents a 53% to 47% split, again in favour of males. There were also a few vacant positions, that depending on who filled them could affect the width of the gap.
The lowest rung on the organization chart is where we find supervisors and coordinators. 60 people are represented here, again with a couple of vacancies. At this level, the split is close to 50/50 with 31 females and 28 males. The ladies take this final round with a 53% to 47% split.
Conclusions
The Municipality fits the classic definition of having a “Glass Ceiling.” Only at the lowest levels of management is there a nearly 50-50 split between women and men. The higher up the management chain, the gap between the number of men and women in positions of power widens and continues to widen all the way to the top.
Municipality of Chatham Kent Sunshine list
The number of people in various organizational positions can only tell a part of the story. Where the rubber really hits the road is pay. The Sunshine List allows for a look at the top pay for the top earners within the Municipality. The intent here is not to investigate if those people or positions are worthy of that level of pay. The only thing being considered is how many of each gender gets how much. It should also be noted that the Sunshine List is not being mapped directly to the Municipal Org chart.
By examining the Sunshine List, certain conclusions can be drawn from that data.
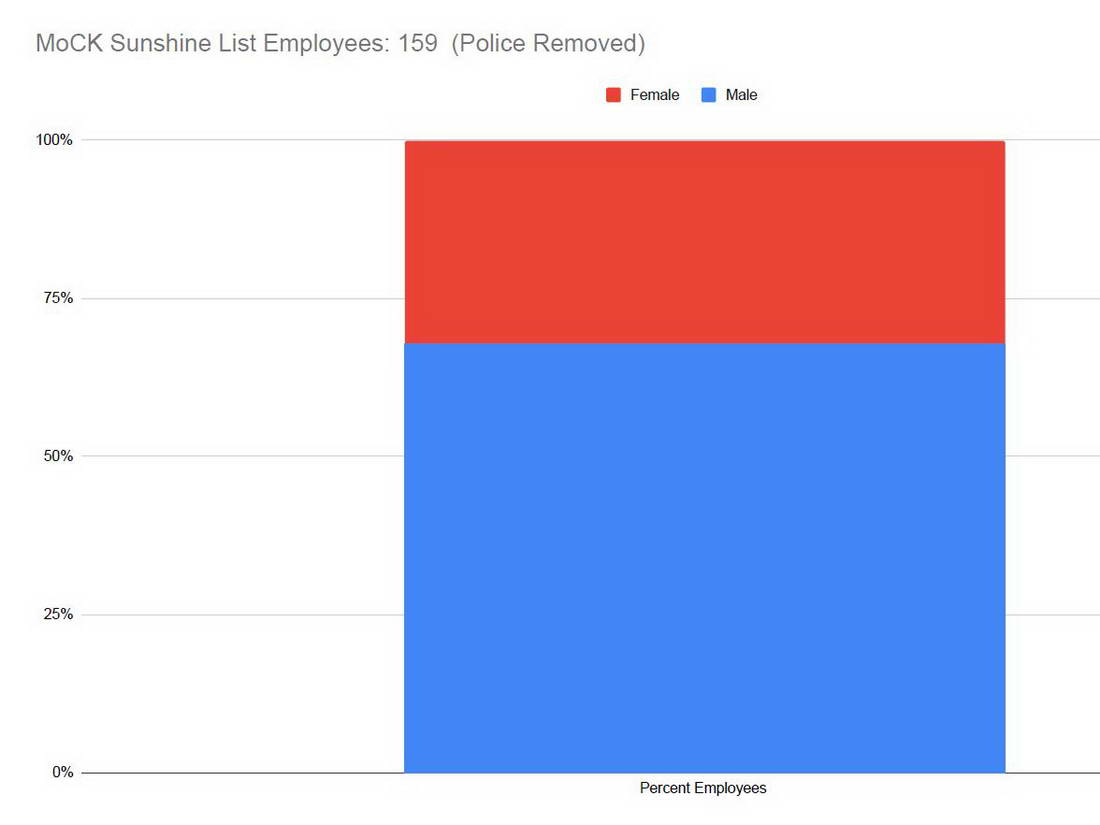
There was a lot of police personnel included last year. However, for the purposes of this analysis, they have been excluded as their hiring procedure and budget are separate from the rest of the Municipal Corporation. The remaining 159 Municipal employees who earned over $100,000 last year then become the subject of the analysis.
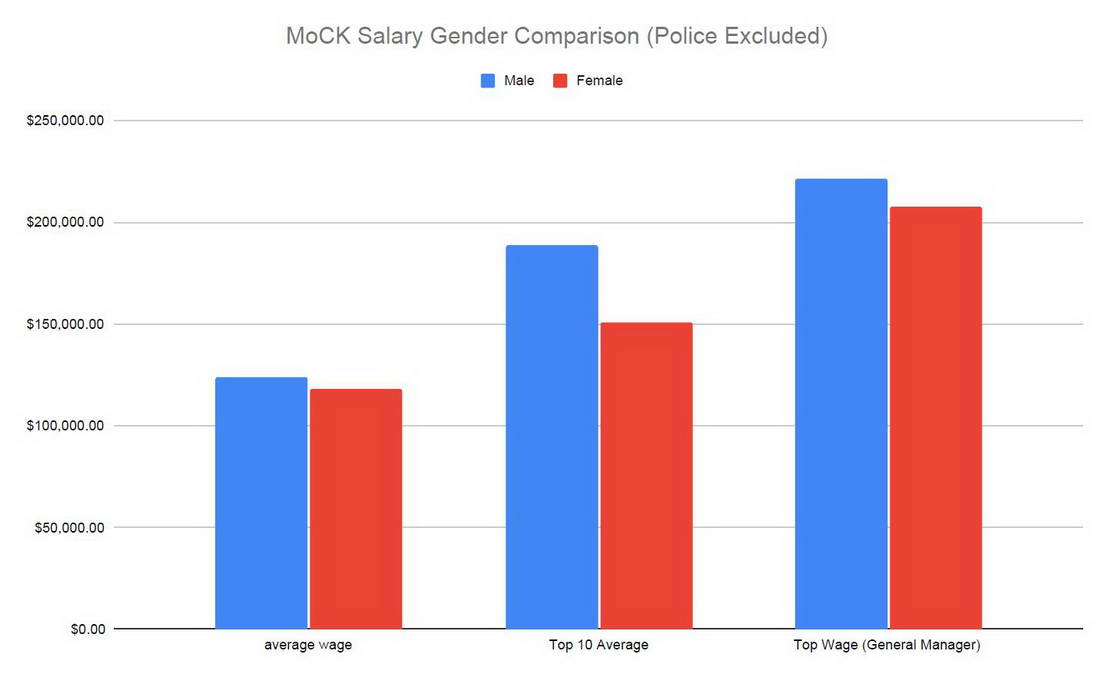
Salaries ranged from $260,000 at the top, to $102,000 at the bottom of the list. There were 108 men, earning an average of $124,000 compared to 51 women at $118,000. The top 10 earners averaged $189,000 for men and $151,000 for women.
Within the Municipality of Chatham-Kent, there are three areas that historically tend to be dominated by one gender or the other. The Fire Department tends to be mostly male while nursing tends to be mostly female. With that in mind, the data was once again filtered. All nurses and fire employees were removed from the data unless they appeared on the org chart as part of the management structure.
Filtering reduced the sample size to 99 employees, but again, the men still dominate. 59 were male, and 40 were female, essentially a 60/40 split. Earnings continued to favour men as well, as those men earned an average of $130,000 compared to women who brought in $121,000 on average. The Top 10 earners also favoured men, $190,000 to $169,000.
Conclusions
No matter how you slice it, the Municipality has a “Glass Ceiling” for its top earners. Significantly more men achieve higher-paying positions than their female counterparts. This, again, fits the definition.
However, salaries vary through each position at the General Manager and Director level in a way that could reflect seniority in the organization more than an institutional bias. It was undetermined if women at the highest levels in the Municipality of CK are at a pay disadvantage, but it would seem likely they are not.
What does this all mean?
It certainly appears that if you want to rise high in the Municipal management structure there is an advantage to being a male. There is a clear tendency to hire males into positions with greater earning power. Of course, this does not mean that it is done intentionally, although that can not be ruled out in light of this data. There would seem to be an inherent bias built into the process that the Municipality of Chatham-Kent follows when hiring or promoting upper management. Systems, as well as people, can have an inbuilt bias that is not obvious but manifests itself in trends seen within results.
As taxes are the basis for municipal pay, everyone supports getting the highest quality candidates possible into the positions that open. Yet, it boggles the mind to believe that in a population that is split nearly 50/50 between men and women, men are significantly more suited to roles with higher pay and responsibility. The lower down the ranks, the more representative of the community things seem to be.
Why is it that our Municipal hiring practices can develop diversity amongst the largest and lowest management pool but fails when it comes to the highest levels of management? If the general public can’t get that answer, hopefully, someone on Council will.
The Municipality of Chatham-Kent will be in the position to interview and hire a new CAO soon, as Don Shropshire is nearing retirement. This new person will set the tone and emphasis for the entire Municipal Organization. A commitment to accountability and transparency with the public would be a great starting point for Council when they conduct the interviews. From there, hopefully, the new CAO will be willing to review the hiring process in order to make sure it truly is fair and “reflective of the diverse community we serve.”
Please note that we strive for accuracy in articles like this. That being said, some of the data is hand-counted, and there is always the possibility that an entry or two in the spreadsheets gets crossed up. However, we stand by our numbers and believe any errors would not likely change the results in an appreciable way.
Please consider “tipping” your writer. It helps keep the lights on so while we do our digging!


0 Comments